AI/ML with Python Module
Mentor:
Shrideep Dhore , Hridaya Amle & Prathamesh Ingle
Day 1: Python Basics for AI/ML
Python Fundamentals
On the first day, we learned the basics of Python programming which form the foundation for AI and Machine Learning.
Key Python Concepts:
- Variables and Data Types (integers, floats, strings, booleans)
- Data Structures (lists, tuples, dictionaries, sets)
- Control Flow (if statements, for and while loops)
- Functions and Lambda expressions
- File I/O operations
- Error handling with try-except blocks
- List comprehensions
Example Python Code:
# List comprehension example
numbers = [1, 2, 3, 4, 5]
squares = [x**2 for x in numbers]
print(squares) # Output: [1, 4, 9, 16, 25]
# Dictionary example
student = {
"name": "John",
"age": 21,
"major": "Data Science"
}
print(student["name"]) # Output: John
Python Syntax
Clean and readable syntax with significant whitespace.
Data Structures
Powerful built-in data structures for efficient data handling.
Functions
First-class functions and support for functional programming.
Day 2: NumPy Library
Numerical Computing with NumPy
On the second day, we explored NumPy, the fundamental package for scientific computing in Python.
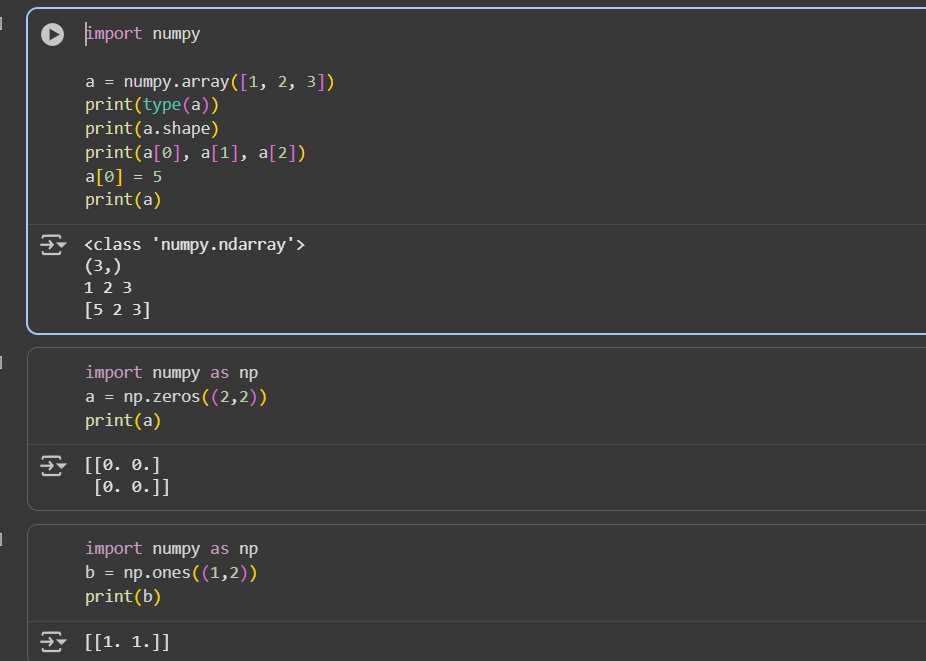
NumPy Key Features:
- c:\Users\sayya\Pictures\Screenshots\Screenshot 2025-09-20 234540.png
- Powerful N-dimensional array object
- Sophisticated broadcasting functions
- Tools for integrating C/C++ and Fortran code
- Linear algebra, Fourier transform, and random number capabilities
NumPy Code Examples:
import numpy as np
# Creating arrays
arr1 = np.array([1, 2, 3, 4, 5])
arr2 = np.zeros((3, 3)) # 3x3 array of zeros
arr3 = np.ones((2, 4)) # 2x4 array of ones
# Array operations
a = np.array([1, 2, 3])
b = np.array([4, 5, 6])
print(a + b) # Output: [5 7 9]
print(a * b) # Output: [4 10 18]
# Reshaping arrays
arr = np.arange(12)
reshaped = arr.reshape(3, 4)
print(reshaped)
ND Arrays
Efficient multi-dimensional arrays for numerical data.
Broadcasting
Powerful broadcasting capabilities for array operations.
Random Module
Comprehensive random number generation for simulations.
Day 3: Matplotlib Library
Data Visualization with Matplotlib
On the third day, we learned about Matplotlib, a comprehensive library for creating static, animated, and interactive visualizations.
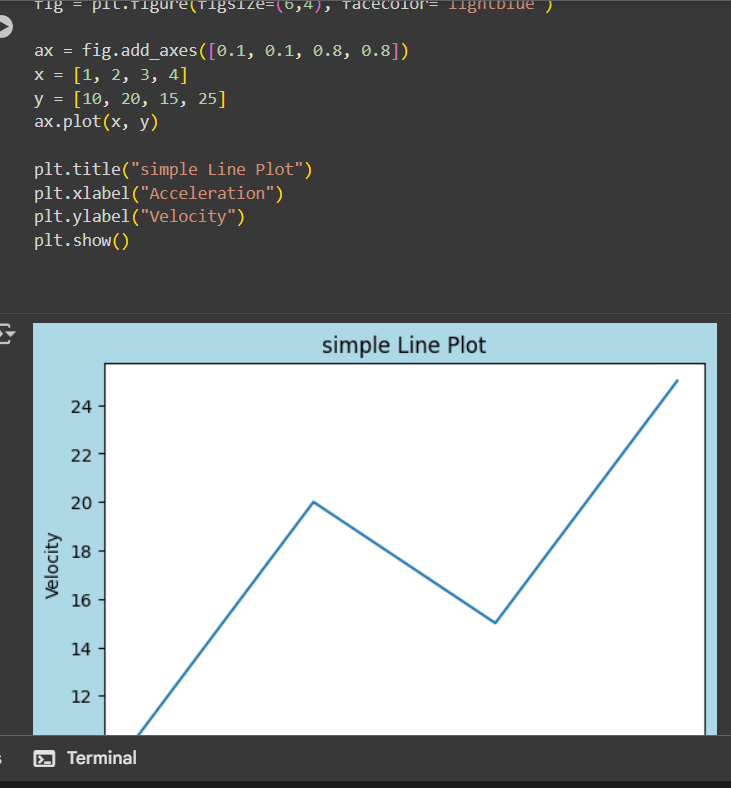
Matplotlib Key Features:
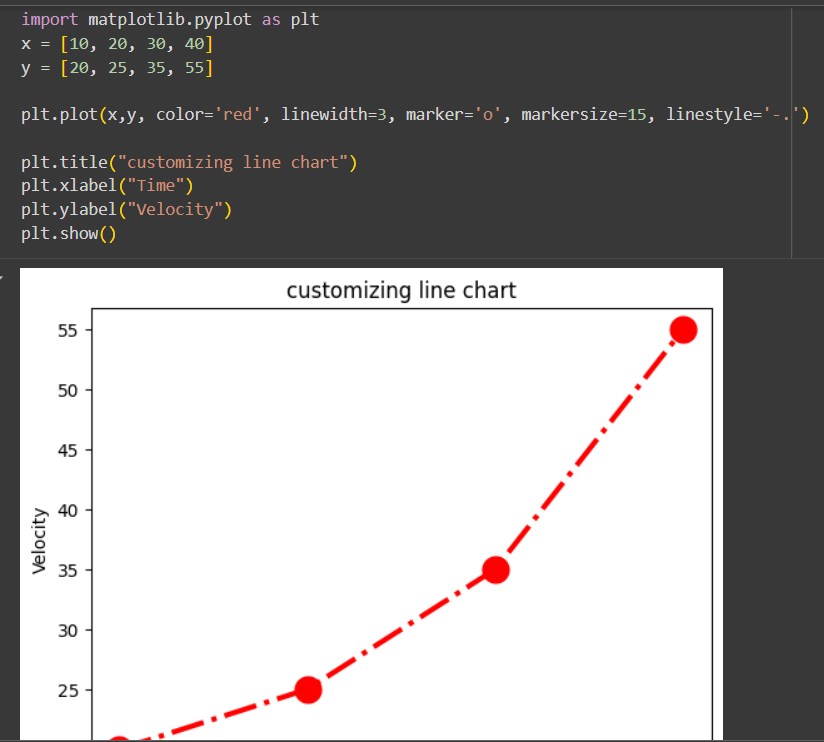
- Line plots, scatter plots, bar charts, histograms
- Pie charts, stem plots, contour plots
- Customizable labels, titles, and legends
- Multiple subplots in one figure
- Save figures in various formats (PNG, PDF, SVG, etc.)
Matplotlib Code Examples:
import matplotlib.pyplot as plt
import numpy as np
# Simple line plot
x = np.linspace(0, 10, 100)
y = np.sin(x)
plt.plot(x, y)
plt.title('Sine Wave')
plt.xlabel('x')
plt.ylabel('sin(x)')
plt.show()
# Scatter plot
x = np.random.randn(100)
y = np.random.randn(100)
plt.scatter(x, y)
plt.title('Scatter Plot')
plt.show()
Line Plots
Create detailed line plots with customization options.
Scatter Plots
Visualize relationships between variables with scatter plots.
Bar Charts
Compare categorical data with various bar chart styles.
Day 4: Seaborn Library
Statistical Data Visualization with Seaborn
On the fourth day, we explored Seaborn, a Python data visualization library based on Matplotlib that provides a high-level interface for drawing attractive statistical graphics.
Seaborn Key Features:
- Built-in themes for styling Matplotlib graphics
- Visualization of univariate and bivariate distributions
- Plotting statistical time series data
- Tools for fitting and visualizing linear regression models
- Functions for visualizing matrices and using color palettes
Seaborn Code Examples:
import seaborn as sns
import matplotlib.pyplot as plt
# Load example dataset
tips = sns.load_dataset("tips")
# Create a violin plot
sns.violinplot(x="day", y="total_bill", data=tips)
plt.show()
# Create a heatmap
import numpy as np
uniform_data = np.random.rand(10, 12)
ax = sns.heatmap(uniform_data)
plt.show()
# Pair plot for multivariate analysis
iris = sns.load_dataset("iris")
sns.pairplot(iris, hue="species")
plt.show()
Statistical Plots
Specialized plots for statistical analysis like violin plots.
Heatmaps
Visualize matrix-like data with color-coded heatmaps.
Pair Plots
Explore relationships between multiple variables simultaneously.
Practice & Assignments
Hands-on Exercises
After learning the essential libraries, we practiced with various exercises and assignments to solidify our understanding.
Practice Exercises:
Exercise 1: NumPy Array Operations
Create a 5x5 array with random values and find the minimum and maximum values. Then normalize the array so all values fall between 0 and 1.
Exercise 2: Matplotlib Visualization
Create a line plot of the sine and cosine functions from 0 to 2π. Add a legend, title, and customize the line styles and colors.
Exercise 3: Seaborn Statistical Plot
Load the built-in "tips" dataset in Seaborn and create a visualization that shows the relationship between total bill and tip amount, differentiated by time of day (lunch vs dinner).
Exercise 4: Comprehensive Project
Create a Jupyter notebook that demonstrates data loading, cleaning with Pandas, analysis with NumPy, and visualization with both Matplotlib and Seaborn using a real-world dataset of your choice.
Learning Outcomes:
- Ability to manipulate numerical data efficiently with NumPy
- Skills to create various types of plots with Matplotlib
- Understanding of statistical visualization with Seaborn
- Experience with real-world data analysis workflows
- Preparation for more advanced machine learning concepts
Additional Resources
Further Learning
Expand your AI/ML knowledge with these recommended resources.
Recommended Books
• "Python for Data Analysis" by Wes McKinney
• "Hands-On Machine Learning with Scikit-Learn, Keras, and TensorFlow" by Aurélien Géron
• "Python Data Science Handbook" by Jake VanderPlas
Online Resources
• NumPy Official Documentation
• Matplotlib Gallery
• Seaborn Tutorials
• Kaggle Learn Courses
Practice Platforms
• Kaggle Notebooks
• Google Colab
• Jupyter Notebook
• DataCamp Exercises